
Staying Grounded When the Headlines Won’t Let You

HWM Market Recap - April 2026

|
It has been a turbulent few months for financial markets and geopolitics, to say the least. The conflict in Iran, which began on February 28, set off a chain reaction of market swings, energy price spikes, and an unrelenting stream of unsettling headlines.
And yet, despite ongoing uncertainty around the war in Iran, including an extended ceasefire and unsuccessful peace negotiations, the stock market has climbed back into positive territory for the year, quietly recovering most of its earlier losses and even notching several new all-time highs along the way.
What makes this moment particularly striking is the contrast between the market’s recovery and the public mood. Consumer sentiment has cratered to one of the lowest readings in modern history – below levels recorded during the 1970s stagflation crisis, the aftermath of the September 11th attacks, the Great Financial Crisis, and even the depths of the COVID-19 pandemic.
So, what explains the disconnect?
Part of the answer is simply the environment we’re living in. The headlines are relentless: war, tariffs, rising prices, political dysfunction, energy shocks, and an ever-present anxiety that artificial intelligence is coming for everyone’s job. It’s an exhausting backdrop, and it’s hard to tune out.
That environment feeds a very human psychological tendency known as recency bias – our tendency to assign more weight to recent events than the broader sweep of history. It’s one of the most reliable ways investors talk themselves into decisions they later regret. When the most recent headlines feel uniquely dire, it’s easy to conclude that this time really is different, and that the old rules no longer apply. But historically, that conclusion has rarely been correct.
The Markets In Concrete Terms
Let’s look at how the market has performed so far this year. At its March low, the S&P 500 had declined about 9% from its highs. Markets then began to recover on positive developments in Iran, resulting in a 12% rebound during the first three weeks of April alone. For investors who stayed the course, that recovery rewarded their patience.
While the situation is still evolving, this is a reminder of a pattern in financial history: investor sentiment tends to be at its most negative right before markets begin to recover. This is not to suggest that markets always rebound quickly, or that every decline is short-lived. However, what history shows is that reacting to short-term volatility by moving to the sidelines can be costly. The investors who fare best over time tend to be those who remain focused on their goals rather than the daily headlines.
Putting Volatility in Historical Context
Higher volatility is a reality right now, and the uncertainty surrounding the Middle East conflict means it may persist for some time. But here too, context matters enormously.
The CBOE Volatility Index, or VIX, measures the market’s expectation of near-term volatility in U.S. stocks over the next 30 days. Think of it as a gauge of investor fear: the higher the reading, the greater the anxiety and elevated short-term volatility expectations.
The chart below shows the daily VIX closing and intra-day highs from the start of 1990 through March of this year.
Volatility Has Risen but Remains Far Below Many Periods in the Past
VIX Index Levels Since 1990
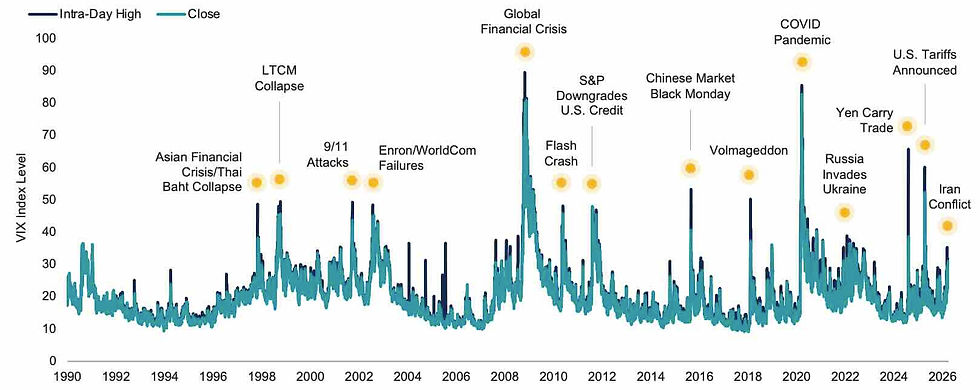
Data from 1/1/1990 – 3/31/2026. Source: CBOE. The VIX Index tracks the expected 30-day future volatility of the S&P 500 Index.
While the recent rise is real and should not be dismissed, there have been several hundred days since 1990 when the VIX surpassed its March 2026 high. Just since 2020, volatility has spiked above current levels during the COVID-19 pandemic, the Russian invasion of Ukraine, the unwinding of the Yen carry trade, and U.S. tariff announcements. Each episode felt alarming in the moment, and each time, markets moved through it.
What Consumer Sentiment Is Actually Telling Us
Another measure of investor confidence is the University of Michigan’s Consumer Sentiment Index. A few weeks ago, the university announced that consumer sentiment had fallen to a 74-year low. Intuitively, that may feel like a warning sign, but historical data suggests it may be closer to the opposite.
JPMorgan analyzed S&P 500 performance following peaks and troughs in the consumer sentiment index, dating back to the 1970s. They found that when sentiment is at a peak, the S&P 500’s subsequent 12-month return averaged just 4.8%. However, when sentiment hits a trough, the subsequent 12-month return averaged 24.1%.
Consumer Sentiment Index* & Subsequent 12-Month S&P 500 Returns

Source: FactSet, Standard & Poor’s, University of Michigan, J.P. Morgan Asset Management.
Peak is defined as the highest index value before a series of lower lows, while a trough is defined as the lowest index value before a series of higher highs. Subsequent 12-month S&P 500 returns are price returns only starting from the end of the month and excluding dividends. Past performance is no guarantee of future results. *Data prior to August 2024 adjusted by J.P. Morgan Asset Management to account for methodological changes by the University of Michigan. Guide to the Markets – U.S. Data are as of April 28, 2026.
In other words, the best forward returns have historically shown up precisely when investors felt worst. That doesn’t guarantee the next twelve months will follow the same script. But it does mean that the current wave of pessimism is not a reliable forecast of what comes next, and acting on it has historically been a mistake.
How Today’s Economic Data Stacks Up
Sentiment and volatility tell part of the story. But what about the underlying economic data? Oil prices, inflation, interest rates, economic growth, and more are routinely in the news. So how do they actually compare to recent history?
The chart below shows a broad set of market and macroeconomic indicators, with each metric’s current reading plotted against its highs and lows since the start of 2020.
Investors Have Faced a Wide Range of Headline Data Since 2020
Macroeconomic and Commodity Price Metrics

Data from 1/1/2020– 3/31/2026. GDP Source: U.S. Bureau of Economic Analysis (BEA) and the Federal Reserve Bank of Atlanta’s GDPNow. U.S. Unemployment Source: U.S. Bureau of Labor Statistics (BLS). U.S. Inflation Source: U.S. Bureau of Labor Statistics (BLS) and the Federal Reserve Bank of Cleveland’s Inflation Nowcasting. Brent Crude, WTI Crude, and U.S. Average Gasoline Price Source: U.S. Energy Information Administration (EIA).
The key takeaway is that while conditions are elevated in several areas, current readings remain within the range investors have already absorbed before in just the past six years. Oil prices, though meaningfully higher than before the conflict began, are still below the peaks reached after Russia invaded Ukraine in 2022. Inflation, while ticking up, remains well below the 9% peak of June 2022. GDP growth, forecast at 1.6% for Q1 2026, is modest but stable.
While uncertainty is high, none of the most commonly cited indicators have breached the extremes investors have already lived through, and for those who stayed invested through those extremes, global stock markets delivered strong results. Since January 2020, through a pandemic, a European war, major tariff shocks, and now a Middle East conflict, the S&P 500 is up approximately 122% cumulatively. Global stocks gained nearly 90% in USD terms over the same period.
The Bottom Line
Every period of market turbulence feels unique when you’re living through it. And in some ways, this one is: the geopolitical dynamics in the Middle East, the specific pressures on energy markets, the particular mix of economic crosscurrents. No two downturns are identical.
But the underlying pattern is remarkably consistent. Markets recover. Hightened volatility subsides. The investors who fare best are those who stay focused on their long-term goals rather than the daily news cycle, not because they’re indifferent to what’s happening in the world, but because they understand that their financial plan was designed to absorb exactly these kinds of shocks.
The data doesn’t promise that the road ahead will be smooth. What it does show, clearly and repeatedly, is that patience and discipline have been rewarded, even through the hardest times.
|
Monthly Changes in Indices
| Year-to-Date Changes in Indices
|
Monthly Performance By Sector
| Year-to-Date Sector Performance
|
|
Interest Rates: In what may have been his final press conference as chairman of the Federal Reserve, Jerome Powell announced that the Federal Open Market Committee (FOMC) will hold interest rates steady for the third consecutive meeting, following three consecutive cuts last year.
Inflation: The Consumer Price Index (CPI) increased 0.9% month-over-month in March. Over the last twelve months, CPI increased 3.3%. Core CPI (which excludes food and energy) increased 0.2% in March compared to February and rose 2.6% compared to a year ago.
Housing: According to the National Association of Realtors, existing home sales decreased 3.6% month-over-month in March and decreased 1% from one year ago. The median existing-home sales price rose 1.4% from March 2025 to $408,800. The Census Bureau has not yet released data for this month's sales of new single-family houses.
Mortgage Rates: As of April 23rd, 2026, the weekly average for a 30-year fixed-rate mortgage is 6.23%, below the 52-week average of 6.4% and down 0.58% from a year ago.
Employment: According to the Bureau of Labor Statistics' Employment Situation Summary, unemployment was little changed in March at 4.3%. Job gains occurred in health care, construction, and transportation and warehousing.
Consumer Sentiment: The University of Michigan's Surveys of Consumers dipped 6.6% in April – now comparable to the June 2022 trough. Compared to its reading from one year prior, consumer sentiment is down 4.6%. Year-ahead inflation expectations surged from 3.8% in March to 4.7% in April, the largest one-month increase since April 2025. Long-run inflation expectations climbed to 3.5% after hovering between 3.2% and 3.3% for the last four months.
If you liked this post, please share it with someone who might benefit from it, and let us know if you have any comments or questions!
About the Author
Holzberg Wealth Management is a family-owned and operated financial planning and investment management firm based in Marin County, CA. As your financial advisors, we serve you as a fiduciary and are fee-only, so we never receive commissions of any kind. We help individuals and families like you in the greater San Francisco Bay Area and nationwide with the financial decision-making process to organize, grow, and protect your assets.
** This writing is for informational purposes only. The author and Holzberg Wealth Management do not guarantee or otherwise promise any results that may be obtained from using this report. No reader should make any investment decision without first consulting their financial advisor and conducting their own research and due diligence. These commentaries, analyses, opinions, and recommendations represent the personal and subjective views of the author and do not constitute a recommendation, offer, or solicitation to make any securities transaction. The information provided in this report is obtained from sources that the author believes to be reliable. External links to third parties are being provided for informational purposes only. Holzberg Wealth Management is not affiliated with the third-party websites linked to, unless otherwise explicitly stated, and does not constitute an endorsement or approval by Holzberg Wealth Management of any of the third party’s products, services, or opinions. Past performance is not a guarantee of future results. Indices are not available for direct investment; therefore, their performance does not reflect the expenses associated with the management of an actual portfolio. Any charts and graphs provided are hypothetical and for illustrative purposes only, are not indicative of any investment, and assume reinvestment of income and no transaction costs or taxes.


